Note: The Calabi-Yau manifold explorer was heavily integrated into some of the design choices and database components of my old website. It is deactivated at the moment, but I am working on rebuilding it in a separate manner. After all, I am still getting inquiries and requests about it. The manual below refers to the old version and I mostly plan on keeping it this way.
Overview
Calabi-Yau manifolds are Kähler manifolds with vanishing Ricci curvature, which implies quite a number of mathematical properties. Physically one can interpret them as non-trivial vacuum solutions to Einstein’s theory of gravity. Their existence was first conjectured by Calabi in the ’50s and two decades later proven by Yau, thus the name. They play a central role in 10-dimensional string theory, i.e. the Type II superstring as well as the heterotic string. Here Calabi-Yau 3-folds (three complex dimensions) naturally arise in the compactification of the six hidden dimensions if one wants to keep a limited amount of supersymmetry in the resulting effective 4d theory. Quintic Calabi-Yau
However, the existence proof and subsequent developments do not provide an detailed description of those spaces. Up to this day not a single metric for a compact Calabi-Yau space is explicitly known, yet hundreds of thousand distinct manifolds have been constructed. One is therefore forced to entirely rely on the topological invariants, most importantly the two independant components \(h^{1,1}\) and \(h^{2,1}\) of the Hodge diamond which describe the number of distinct \((p,q)\)-differential forms.
Over the years numerous techniques have been successfully used in the construction of Calabi-Yau manifolds, most importantly in the area of algebraic geometry. Many spaces are specified as hypersurfaces (or intersections thereof) by the vanishing of a homogeneous polynomial inside a projective or toric space. The theory surrounding Calabi-Yau manifolds has sparked a remarkable interplay between physics and geometry during the late 20th century, which is being told in the book “The Shape of Inner Space”.
This page gives an overview over the range of known Calabi-Yau 3-folds. General information about Calabi-Yau manifolds can be found on Wikipedia or Scholarpedia.
Note: The Hodge plot in the Explorer requires an activated JavaScript functionality, activated cookies for data management (PHP sessions) and full SVG support (Scaleable Vector Graphics), which is reasonably well implemented in all modern browsers—except all versions of the Microsoft Internet Explorer before IE9. However, on a mobile phone this could be a problem.
Usage manual
The Calabi-Yau 3-fold explorer is fairly self-explanatory, but a couple of fine points should be mentioned. In the main menu, which you reach by clicking on the prominent link above, you can select some overall parameters for the Hodge pair plot. For example, you can select up to four references which are to be highlighted by different primary colors in the plot. Furthermore, you can specify additional pairs of Hodge numbers that are added as small stars to the plot. I recommend playing around with the settings for a while to see the individual effects. Once you click on “Open Hodge Plot” button in the main menu, something like the following view will appear:
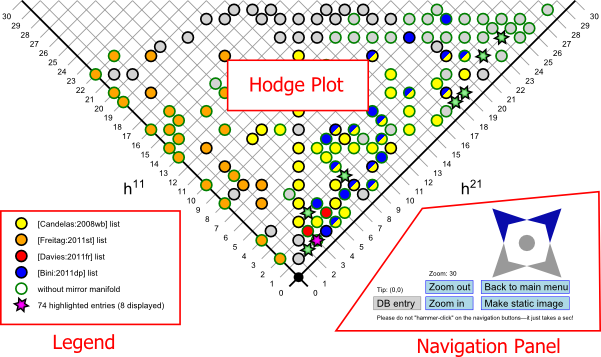
The Hodge plot basically consists of three object: the interactive Hodge plot itself (obviously), the legend for the coloring scheme and the navigation panel. The legend should be fairly self-explanatory—it simply lists the meaning of the different colorings. Note that when different colorings apply to the same pair of Hodge numbers, gradients or other kind of multi-colorings are used instead of the plain colors.
Via the navigation panel you can move through the plot, i.e. shift the visible part of the plot by clicking on the (somewhat minimalistic) blue star arrows. Note: Unfortunately, due to browser implementation issues, the actual link area (where you click) on those buttons is sometimes not properly aligned to the graphics. I have no influence on this problem as it is entirely a browser problem—so you may have to try a bit before you find the actual clicking area for one of those arrow buttons. By clicking on the big dot in the middle, the view is automatically shifted back to the origin. As a sort of “reference point” in the two-dimensional space of Hodge number pairs serves the tip of the Hodge plot, which in the picture above coincides with the origin \((h^{1,1},h^{2,1})=(0,0)\). The tip is automatically the selected pair of Hodge numbers. You can also shift through the view by clicking on the objects within the Hodge plot. When you move you mouse cursor over the Hodge plot, it will show the pair of Hodge numbers numerically and once you click it will be moved to the tip—and therefore be selected.
When you are on top of a known pair of Hodge numbers (i.e. one of the circles is at the tip of the plot) the “DB entry” button (short for “database entry”) becomes available. When you click on it, the database information for the selected pair of Hodge numbers shows up, like the Hodge diamond, whether or not is has a mirror partner, etc. More importantly, here you can read and write comments for the selected pair of Hodge numbers and see in which references it is actually described. By clicking on either “Add comment” or “Add reference comment” you may write an additional comment, which is immediately visible to all users. Comments for a reference are automatically shown for all pairs of Hodge numbers described in that particular reference. Note that new comments at first get a tag “not yet approved”, which will (hopefully soon) be removed once I have had the chance to look it over.
The best feature about the Hodge plot is the fact that it is implemented as a dynamically generated SVG graphic.
Once you find a good spot which holds the right view for your purpose, simply click on “Make static image” to remove the navigation panel and embedded JavaScript portions of the image. Then you can right-click & save the image in your browser and edit it in your favourite vector graphics editor like Inkscape, Adobe Illustrator or Gimp. This makes it particularly easy to embed a plot of the pairs of Hodge numbers easily in a paper, e.g. when you find a couple of new Calabi-Yau 3-folds and want to show the avid reader their place within the Hodge plot.
You can also make an overview plot of all known Hodge numbers: After selecting a coloring scheme and all the other options you want to have on your plot, open the regular plot and check it out first. Then go back to the main menu via the link in the navigation panel. Now you should see a new check box “Open as static max zoom view”. If this option is activated, the plot is generated at maximum zoom (showing ALL 30,000+ pairs of Hodge numbers at the same time!) as a static image. In case you have highlighted points, those will also be shown in their entirety. Note that this option really taxes the webserver and in particular your webbrowser, it might even crash due to the complexity of the arising picture. Use with caution!
Implementation and design choices:
As mentioned above, the Hodge plot is realized as a dynamically generated SVG image that is created by a PHP script on the webserver. The information is stored in a relational MySQL database and split up into comments, references and the actual Hodge pairs. An appropiate index significantly speeds up the relevant SQL queries for the display process. Since all communication between you browser and the webserver is automatically GZIP compressed (if supported), only a rather small amount of data (roughly 5–50 KiB mostly depending on the zoom factor) is actually transferred once you do something in the plot. Therefore, the actual process of moving around in the Hodge plot is quite fast despite the fact that quite a lot of work is going on on the server. Most of the design choices (considering server load, caching and implementation) are based on the assumption that there is in fact only a rather limited group of people in the world who would potentially use this tool.
Acknowledgments
The original list of Hodge numbers was compiled by Rhys Davies, therefore all credits for data collecting go to him. Thorsten Rahn helped me in the debugging process of the 3-fold explorer and made a number of useful suggestions. In case you are using a Hodge plot generated with this tool, some attribution would be appreciated.